MBTA Launches Online Speed Restrictions Dashboard
Posted on March 23, 2023
New tool provides daily data on speed restrictions.
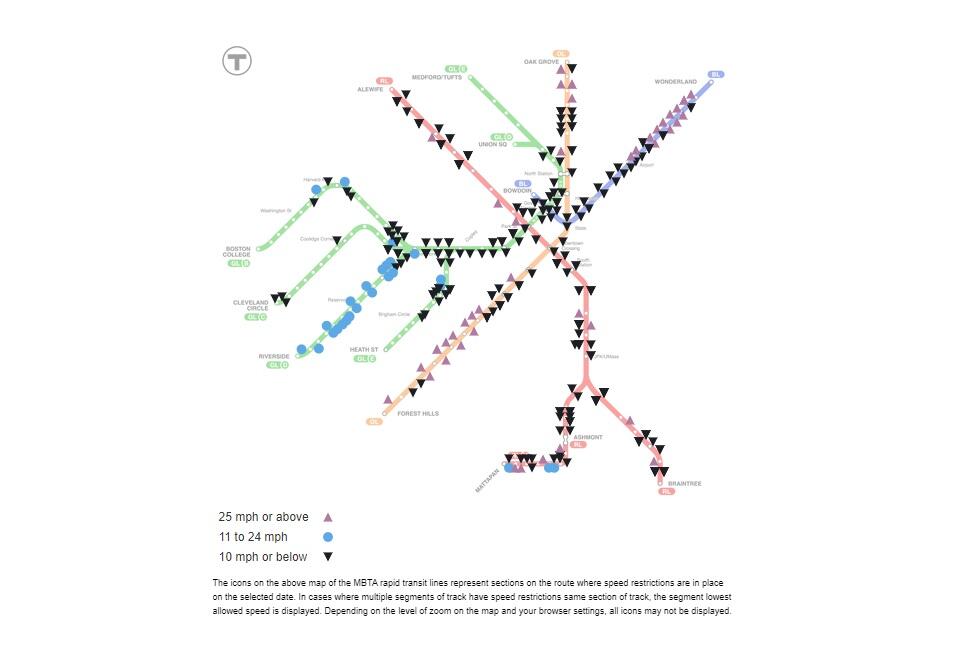
The MBTA today launched a live, online Speed Restriction Dashboard that provides riders with up-to-date information on speed restrictions across the MBTA system. The dashboard reports on location, speed limit, when a restriction was put in place, and the reason for the restriction on the Red, Orange, Blue, Mattapan, and Green lines. The dashboard also provides the percentage of track under restriction, distance by individual line or systemwide, and total number of restrictions and can be viewed at mbta.com/speedrestrictions.
The dashboard is refreshed daily with data provided by the MBTA’s enterprise asset management system and helps riders see where speed restrictions are located with maps they are accustomed to seeing. The speed restriction activity summary will help illustrate the ongoing work the MBTA is doing to clear restrictions within the system. Last month, the MBTA began to provide riders with speed restriction data by releasing a static dashboard that reported information from the previous month.
“Today’s dashboard provides daily updates on our data based on activity from the previous day and was launched with the goal of providing transparent and timely information to our customers,” said Interim General Manager Jeff Gonneville. “The dashboard delivers information that is clear and will assist riders in better understanding why they are experiencing slower conditions while riding the T. As we continue to validate and address track deficiencies, we also expect that over time, this platform will demonstrate the progress we’re making to remove speed restrictions. We know these restrictions impact riders’ daily commutes and we will continue to be transparent about the ongoing, daily work to improve our transit system.”
Users of the dashboard will be able to see when speed restrictions were put in place starting from January 2023 and review a summary of changes over time. This dashboard will provide riders with the latest information available at the start of each day providing a new level of transparency.
The new Speed Restriction Dashboard follows last month’s launch of an online safety dashboard that allows the public to see the status of the T’s progress in responding to the Federal Transit Administration’s (FTA) Safety Management Inspection (SMI) Special Directives. This dashboard includes a description of each Corrective Action Plan, what it is intended to correct, the MBTA’s analysis, recommendations, and the status of steps being taken to address the FTA’s Special Directives.
The Speed Restriction Dashboard was designed as part of the T’s response to the Federal Transit Administration’s Safety Management Inspection. To learn more about the FTA response, visit mbta.com/FTAResponse.
More Information
Media Contact Information
For all queries and comments, please contact: